About this paper
Behind the Scenes: Uncovering TLS and Server Certificate Practice of IoT Device Vendors in the WildHongying Dong*, Hao Shu†, Vijay Prakash†, Yizhe Zhang*,
Muhammad Talha Paracha^, David Choffnes^, Santiago Torres-Arias#,
Danny Yuxing Huang†, Yixin Sun*
*University of Virginia, †New York University, ^Northeastern University,
#Purdue University
This paper has been published at IMC 2023.
Summary
In this research, we conducted a quantitative analysis of TLS/PKI deployment in the IoT context, identifying associated security concerns. By measuring the sharing of TLS instances across IoT vendors and devices, we revealed a widespread use of highly customized TLS libraries that do not correspond to any known TLS implementations, posing potential security risks due to co-located TLS stacks from different services. Additionally, we performed the first known study on server-side certificate management for servers accessed by IoT devices. Our findings underscore critical issues in the TLS/PKI practices of IoT vendors and serve as a call to action, aiming to raise awareness of these security challenges within the broader IoT ecosystem.
Key findings
-
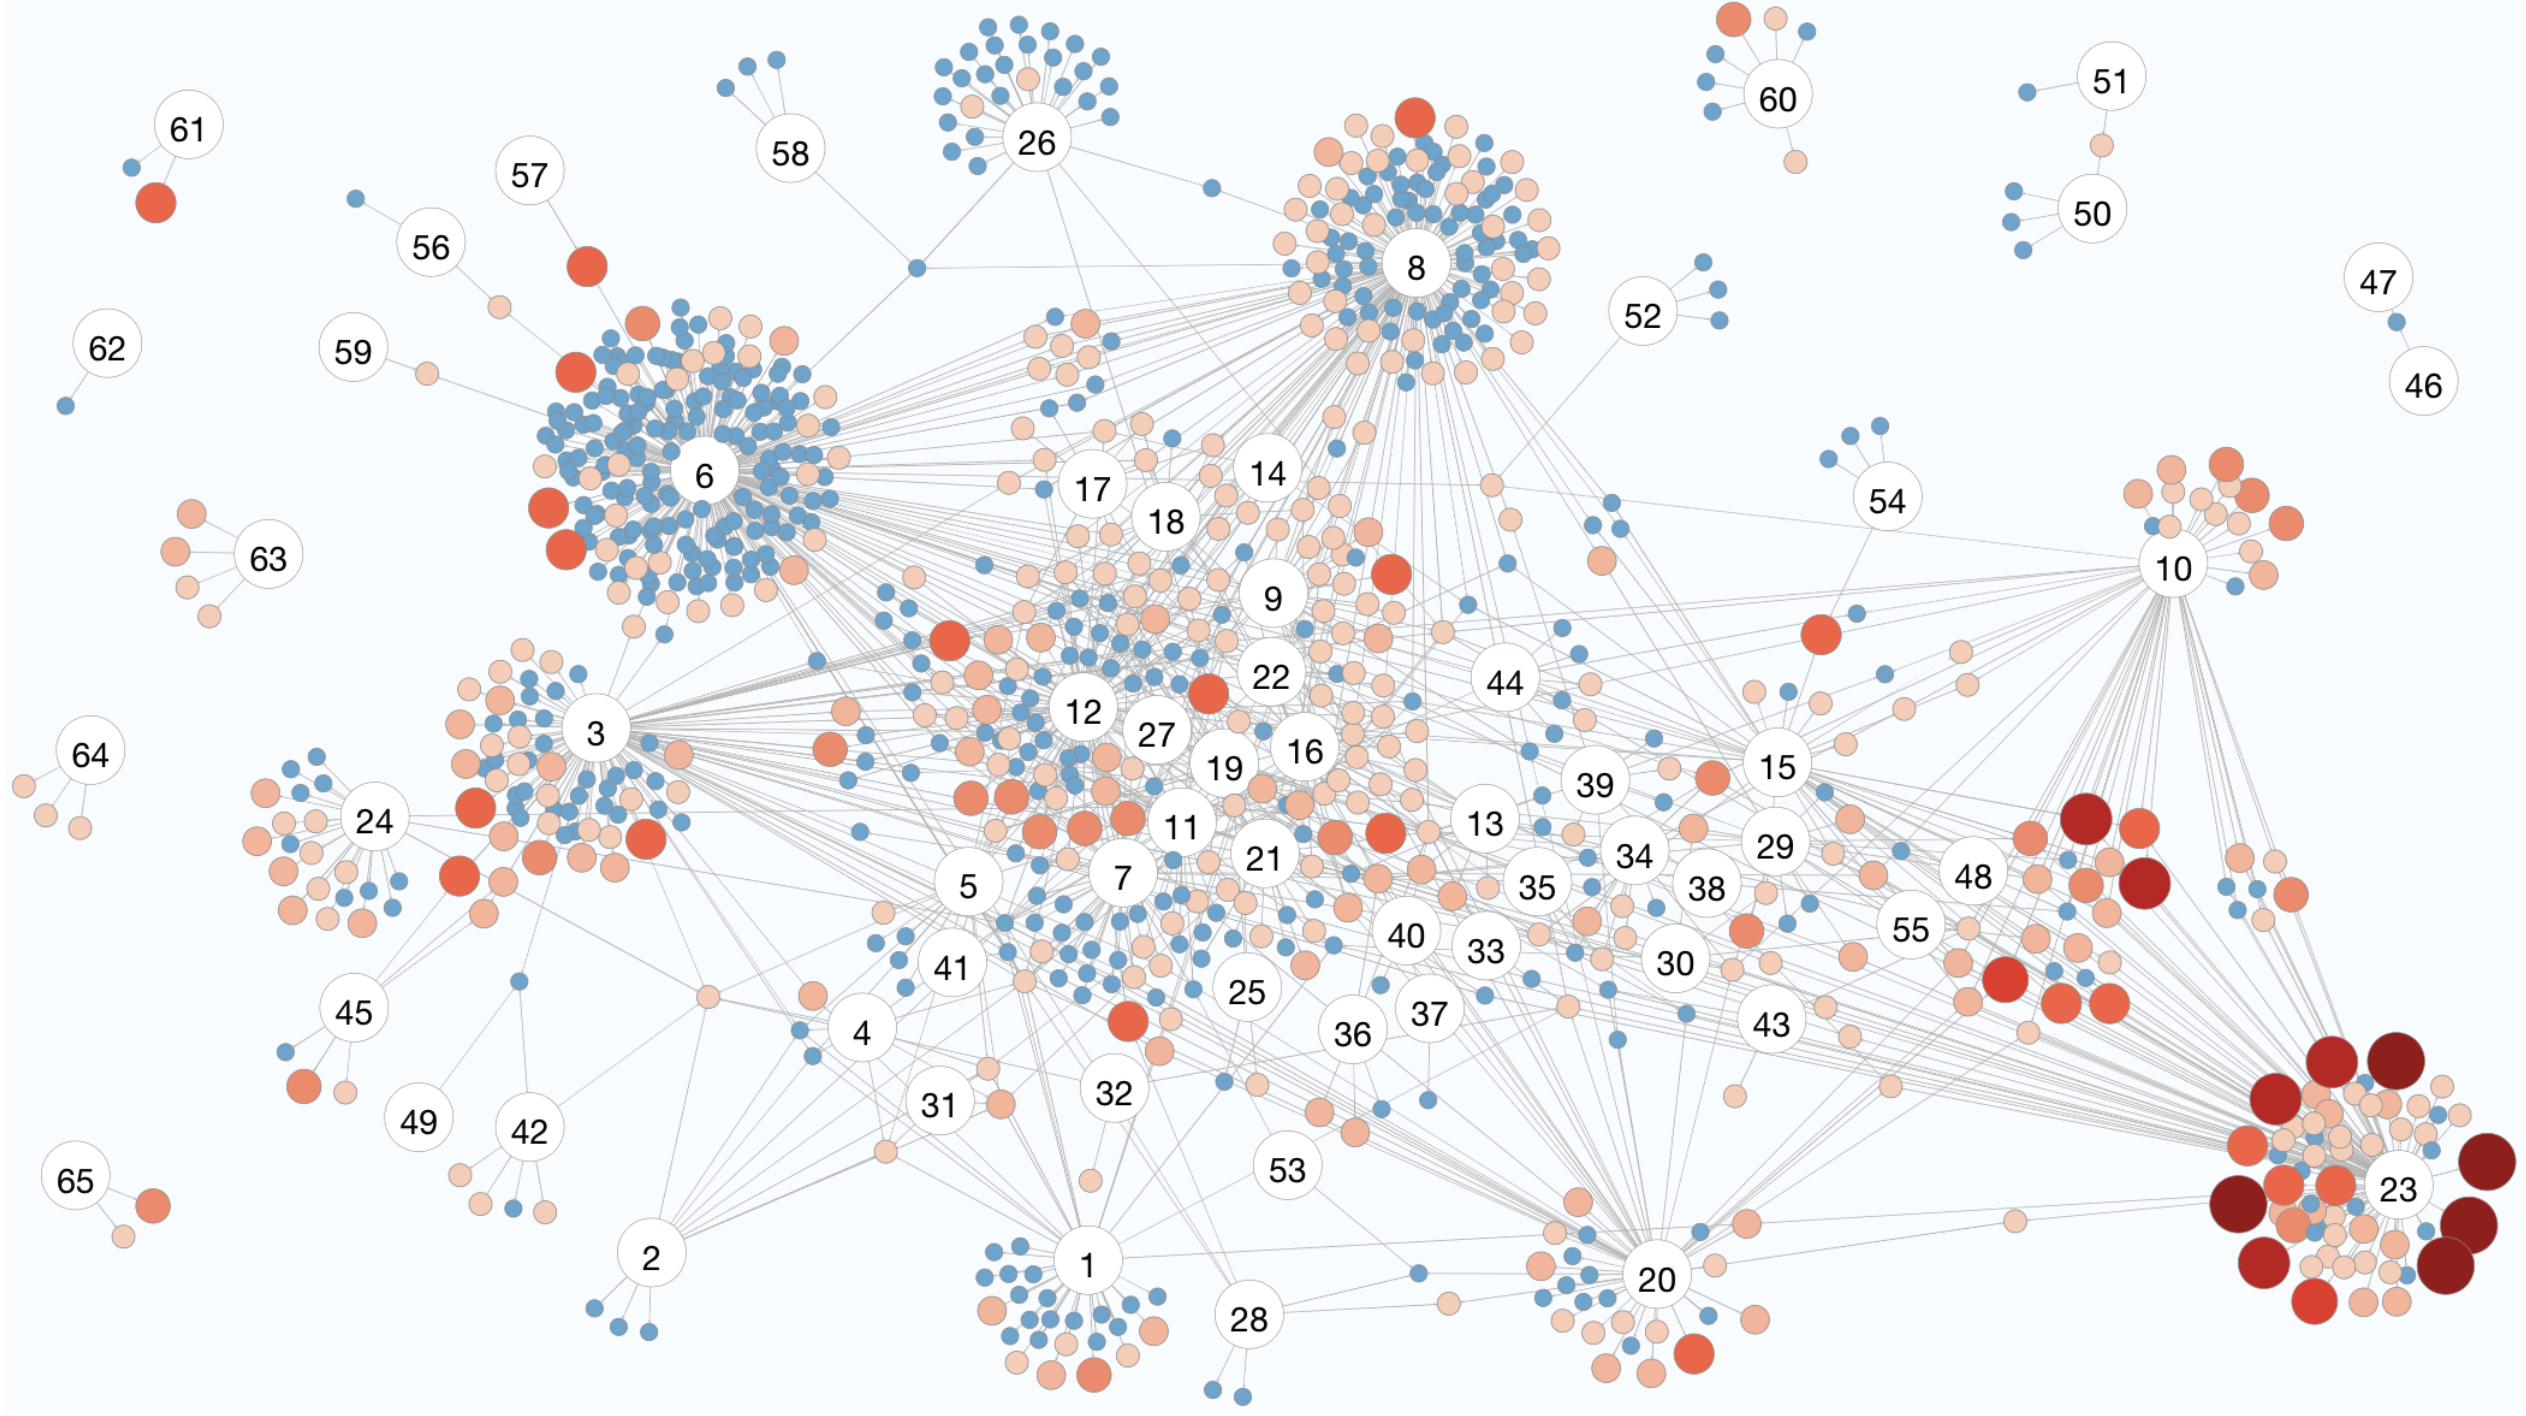
Customization and sharing of TLS instances across vendors and across devices: The majority (77%) of fingerprints are only used by a single vendor, and more than 70% of vendors use at least one unique TLS fingerprint that is not used by other vendors. Additionally, 44.63% fingerprints contain at least one vulnerable component, 31.76% of which are used by multiple devices. Specifically, while only a small fraction of fingerprints are shared across devices within the same vendor, which are likely vendor-specific libraries, the vast majority are only used by a single device, potentially due to application-specific libraries from installed applications on devices. Sharing-wise, 22.48% of fingerprints are shared across multiple vendors, which could potentially be due to: (1) shared supply chain, or (2) shared applications and services.

Figure: TLS fingerprint overview by vendors. Numbered nodes represent device vendors (full mapping in paper Appendix B.6) and colored nodes represent fingerprints. Color blue suggests optimal/suboptimal fingerprints, and colors from orange to red suggest the inclusion of vulnerable versions and/or ciphersuites, with darker color indicating more vulnerable components. The security level of each fingerprint is also illustrated by the node size, with larger suggesting more vulnerable components (specific definition on security levels can be found in paper Section 4.2). Edges are only between vendors and fingerprints, indicating that at least one device of the vendor uses the fingerprint.
-
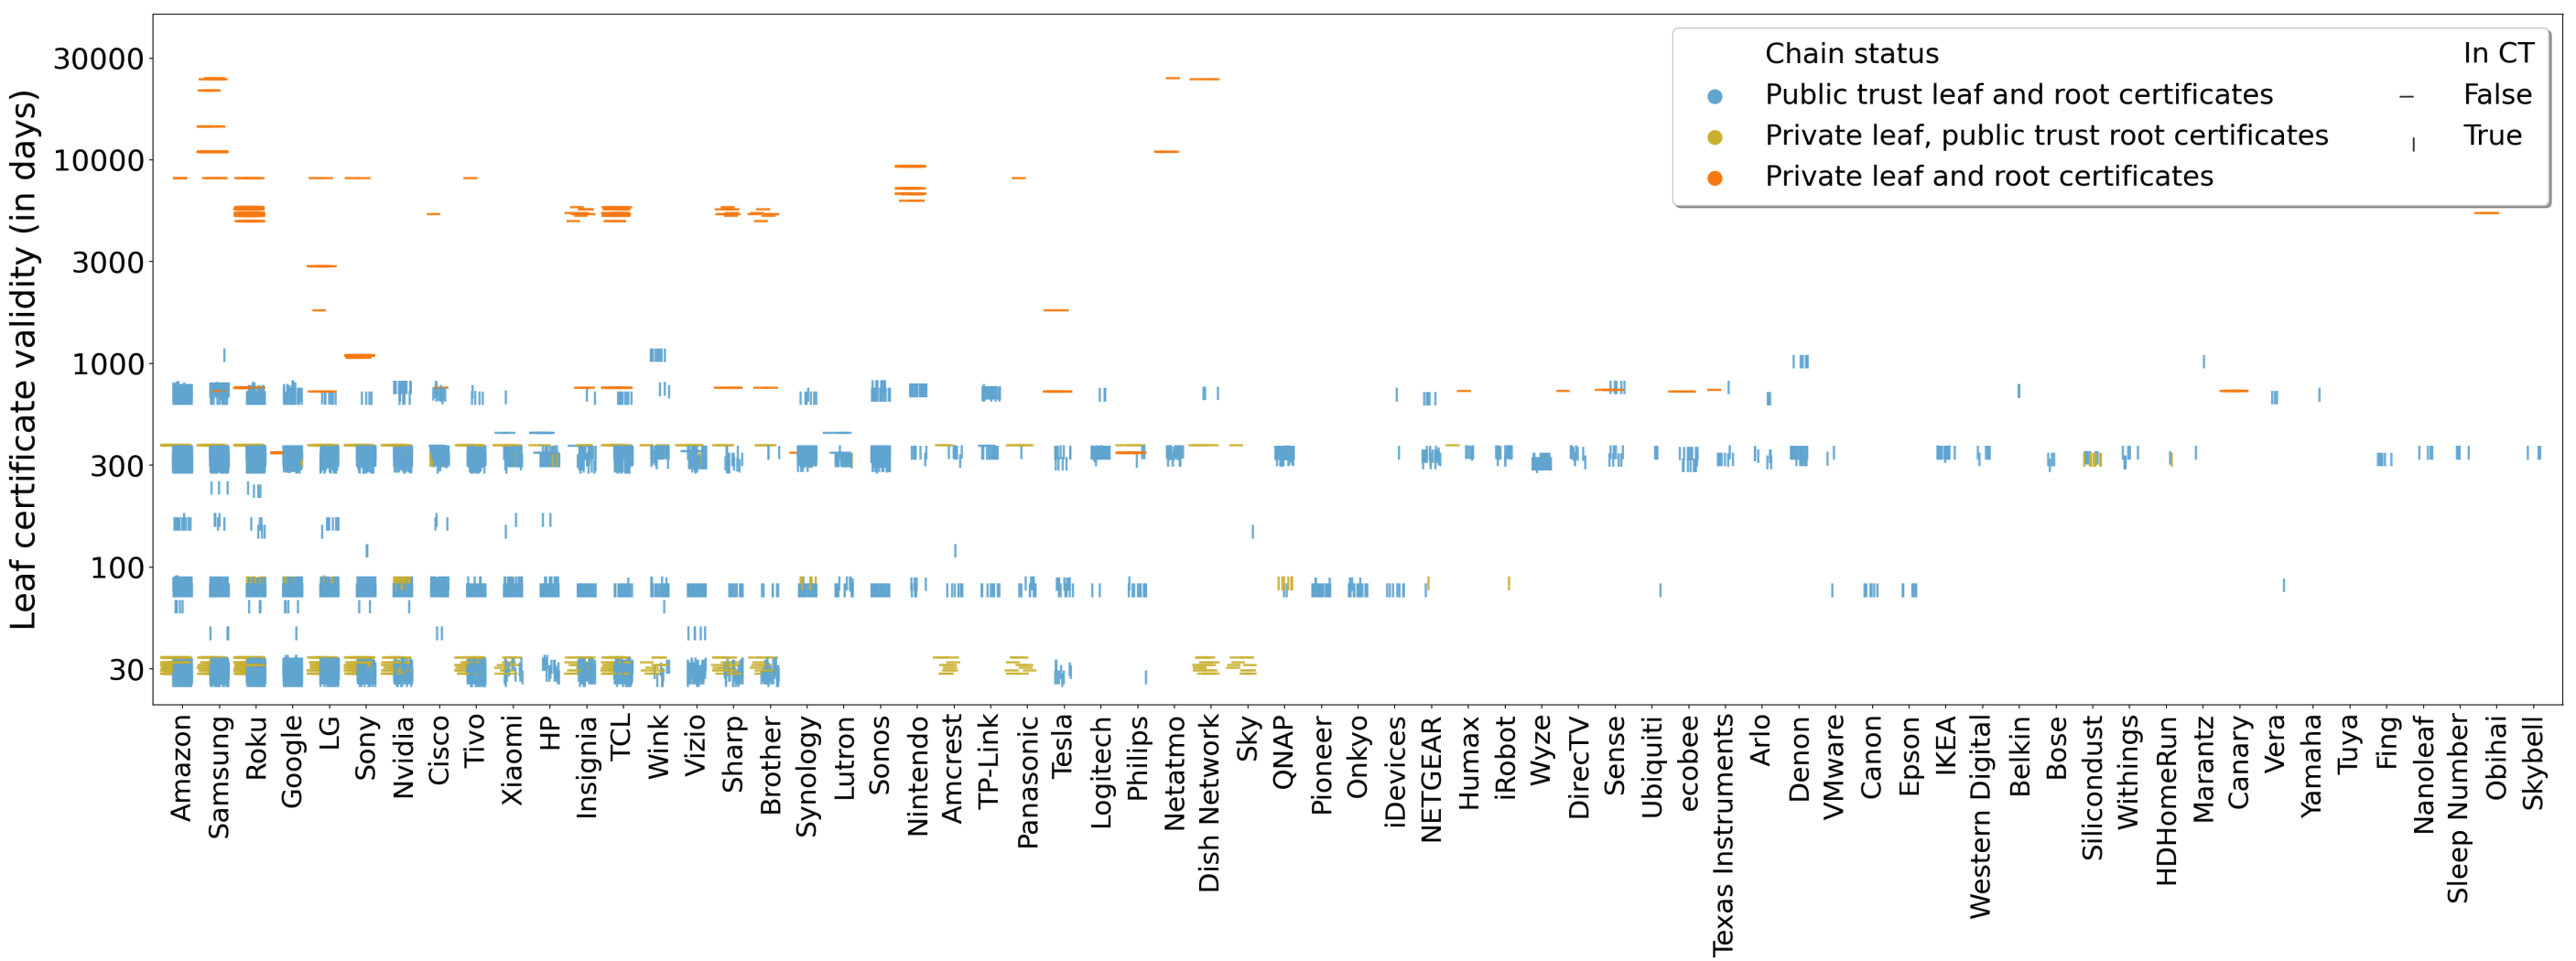
Self-management of IoT server certificates: 9.86% of all server leaf certificates—affecting 391 devices—are signed by device vendors instead of a trusted public CA. Consequently, these certificates are not logged in Certificate Transparency (CT) and many device vendors do not properly manage their certificates. Examples of such poor practice include long-expired certificates and lack of proper certificate chains. Among them, 46.67% have a validity period longer than 5 years.

Figure: Certificates of servers visited by IoT devices. X-axis shows device vendors, and is sorted by the number of appearances of manufactured devices in the dataset. Y-axis shows certificate validity period in days. Colors suggest different chain status: blue represents ‘public trust leaf and root certificates’, yellow speaks ‘private leaf, public trust root certificates’, and orange indicates ‘private leaf and root certificates’. The shape of point shows the corresponding status in CT, with the horizontal line denoting absence and the vertical line signifying its presence.